Met.3D - Interactive 3D visualization of gridded atmospheric (ensemble) datasets
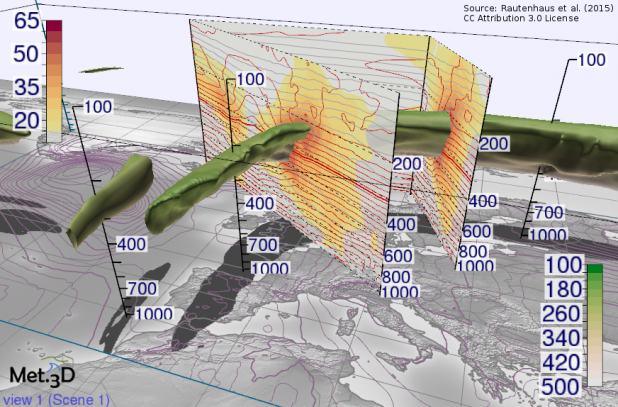
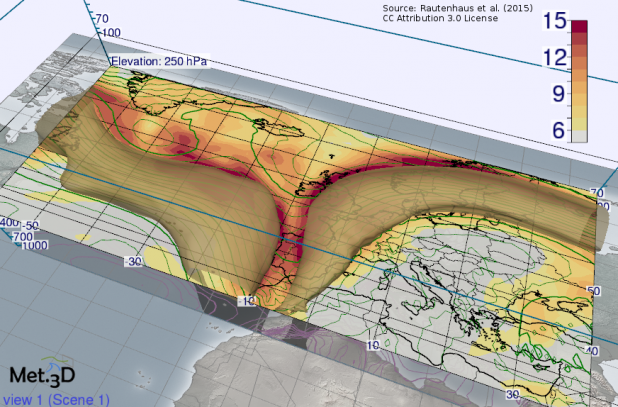
Met.3D is an open-source research software for interactive, three-dimensional visualisation and visual analysis of gridded atmospheric datasets, such as numerical weather predictions or radar observations. Met.3D uses state-of-the-art computer graphics technology and implements a number of recently proposed ensemble visualization methods to facilitate interactive 3D visual data analysis in a novel way.


Met.3D is developed at the Visual Data Analysis Group at the Hub of Computing and Data Science of the University of Hamburg (UHH) and at the Computer Graphics & Visualization Group in the Department of Informatics of the Technical University of Munich (TUM), Germany. Since 2015, we have received ongoing funding from the German Research Foundation (DFG) within the Collaborative Research Centre SFB/TRR 165 Waves to Weather (2015-2024) and the UHH Cluster of Excellence CLICCS. Previously, the development was partly funded by the European Union under the ERC Advanced Grant 291372 SaferVis and the ERC Proof-of-Concept Grant "Vis4Weather".
Met.3D is intended to be used as a visualization framework in the atmospheric sciences, as well as to facilitate research on visualization in meteorology. We have released an open-source version of Met.3D on Gitlab, in addition, experimental research code has led to a number of publications. If you are interested in some of the methods described in the publications, please contact us.
We hope you find the tool useful for your work. Please let us know about your experiences.
| Met.3D is open-source, its source code is available on Gitlab. The software is licensed under the GNU General Public License, Version 3. |


